Understanding your business’s online data is a vital part of knowing what digital marketing campaigns are successful and how to improve underperforming campaigns.
In this blog, we’re going to do a deep dive into what Google Analytics is, how easy it is to use for your business and learn some basics of its reporting features.
What Is Google Analytics?
Originally launched in 2005, Google Analytics is a free tool provided by Google used to track and analyze your website’s traffic.
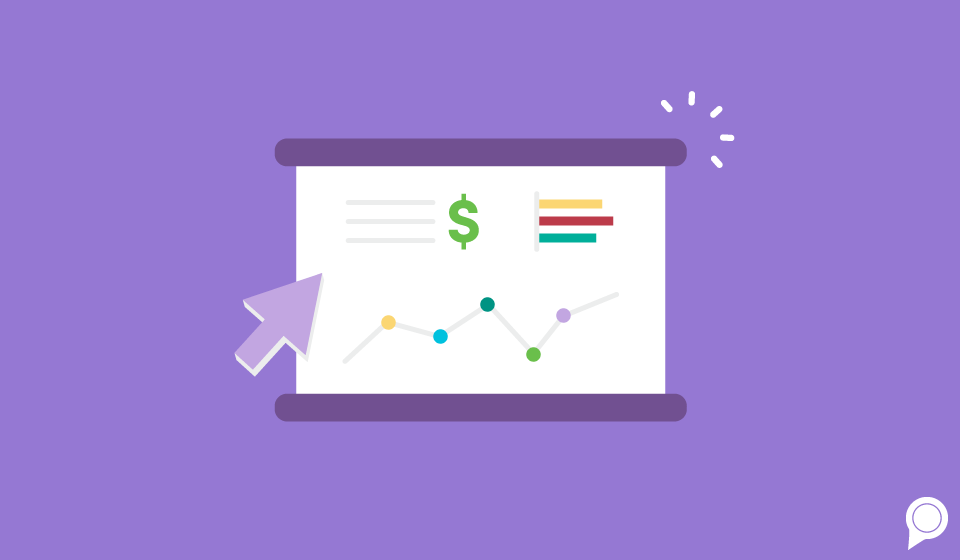
The tool works by collecting data from your website and transforming it into easy-to-read charts, graphs and tables.
Google Analytics offres multiple ways to view your data and customizable dashboards so you can get the data you're most interested in at a glance.
If you use other Google services, such as Google Ads or Google My Business, then it’s important to note that Google Analytics is a necessity for your business. Without this tool aggregating all the data from your website, Google My Business listing and Google Ads campaigns, you're missing out on valuable information to help you improve your business's online marketing efforts.
Using Google Analytics can help you create an integrated digital strategy. In addition to seeing insights from your website, ad campaigns and business listing, you’ll be able to see traffic from other platforms, such as Facebook, YouTube, Hulu and more.
If you don't have time to set up and learn Google Analytics yourself, working with a digital marketing agency can help you set up or get access to your business’s analytics through your website host and help you interpret and put the data into action.
Google Analytics' Reporting Features
Every dashboard of Google Analytics can be customized. Here’s an example account that Google provides for practice:

On the left-hand side of the page, we see tabs with different report options. The data that appears in the graph will vary based on which report you’re looking at.
Let’s break down each of the main report tabs so you can better understand what type of information is featured in each:
If you’re just getting started and aren’t sure what reports are beneficial to look at, here are a few suggestions from RevLocal's strategists:
Please note that these few reports only touch the surface of what Google Analytics can provide for your business. As you learn the platform, you'll begin to become more familiar with all that Google can provide for your business and find which reports are most helpful to you.
Final thoughts...
Google Analytics is an extremely helpful tool to help you measure the success of your website and digital marketing campaigns. Google Analytics is a vital part of tracking data, so if you aren't already using this tool, now is the time to dive in!
Google offers Analytics Academy, which is a free course that teaches you how to use this reporting platform. There are two different levels of courses based on your knowledge level.
At RevLocal, we pair Google Analytics with Reveal, our own marketing analytics dashboard. Businesses who trust RevLocal with their digital marketing get access to our team of experts who provide you with transparent data from all platforms and offer action items to make improvements!
Our dashboard focuses on the data that truly matters and helps you understand where consumers are in the buying cycle. If you'd like to learn more about Reveal, make sure to check out our blog covering the latest updates.
If you want to know more about what it's like to have RevLocal handle your business's digital marekting, feel free to request a demo with one of our local team members.
This blog was written in collaboration with: Angel Ulis, a Lead Digital Marketing Strategist, and Dylan Weaver, a Senior Digital Marketing Strategist.

Lauren Snyder, Content Contributor
Subscribe to our email list to get the latest digital marketing content delivered to your inbox each week!
![45 St Patrick’s Day Phrases to Charm Your Customers]](/images/Blog%20Images/2025/February/45StPatricksDayPhrasesToCharmYourCustomers_BlogGraphic_CMS.png)